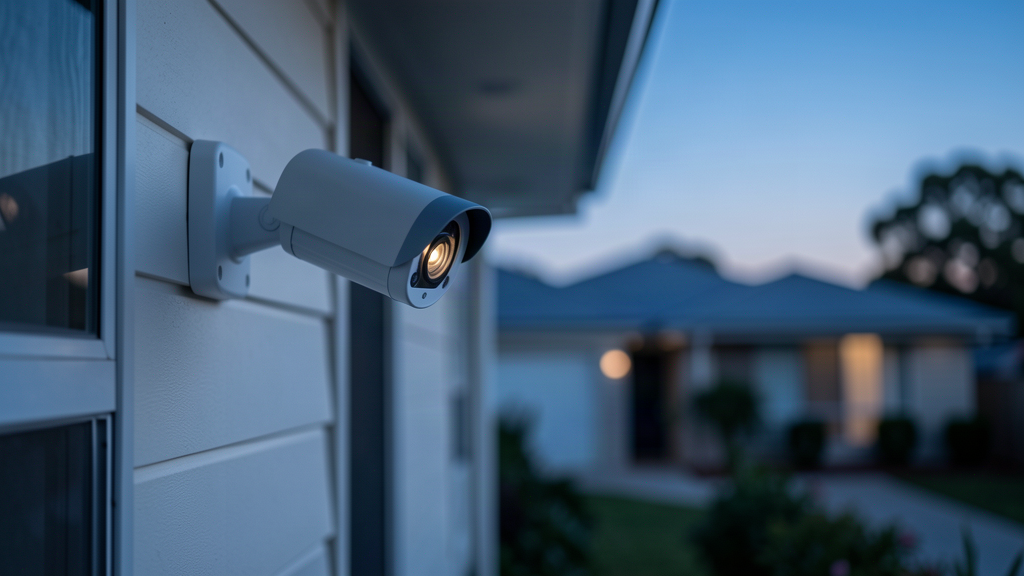

If you live in Australia and you’re shopping for CCTV, you’ve probably seen the same promise: cameras stop break-ins.
Some of that is marketing. Some of it is hope after a neighbour’s place got cleaned out. And some of it is grounded in real research — just not as simply as a product page makes it sound.
This article does two things carefully:
- Lays out current Australian break-in statistics, including state and territory rates from the ABS.
- Separates what crime-prevention research supports about CCTV from what it does not prove for a typical suburban home.
No invented studies. No “cameras cut burglary by X% in every Australian suburb” claims. Just the data and the limits of the evidence.
The short answer (before the sales pitch)
Break-ins are still common enough to take seriously. In 2024–25, about 1.8% of Australian households — roughly 196,600 homes — experienced a break-in, according to the Australian Bureau of Statistics (ABS) Crime Victimisation survey. Another 2.0% experienced an attempted break-in.
CCTV can help reduce some property crime in some settings — especially when cameras are well placed, actively monitored, and paired with other security measures. A major evidence summary used by the UK College of Policing (drawing on a 76-study meta-analysis) found overall crime about 13% lower in places with CCTV than without, with stronger results for property and vehicle crime than for violence.
But cameras are not a guarantee your house won’t be targeted. Australian criminologists and police generally treat CCTV as one layer of home security — useful for deterrence in some cases, and often more clearly useful for investigation and evidence after an incident.
If someone tells you “install these four cameras and your break-in risk disappears,” they’re selling certainty the research does not provide.
Break-ins in Australia right now (national ABS figures)
The cleanest national picture comes from the ABS Crime Victimisation survey (household experiences, not only crimes reported to police).
2024–25 (latest national release)
| Measure | Rate | Households (approx.) |
|---|---|---|
| Break-in | 1.8% | 196,600 |
| Attempted break-in | 2.0% | 217,500 |
| Motor vehicle theft | 0.6% | 64,400 |
Source: ABS, Crime victimisation, 2024–25 financial year (released 25 March 2026).
Other national details worth knowing:
- Break-ins fell from 2.1% of households in 2023–24 to 1.8% in 2024–25.
- Most break-in households had a single incident (76%, or about 150,000).
- About 69% of break-in households reported the most recent incident to police.
- In the most recent break-in incident, 69% had something stolen; 44% had property damaged.
- Longer view: household break-in victimisation was 2.7% in 2014–15 and 1.8% in 2024–25 — lower over the decade, even with year-to-year bumps.
- Risk is not evenly shared: households in the most socio-economically disadvantaged areas had a higher break-in rate (2.6%) than those in the most advantaged areas (1.6%).
- Attempted break-ins were more common outside capital cities (2.5%) than in capital cities (1.8%).
How to read this: victimisation surveys catch incidents people never report. Police-recorded burglary counts are a different dataset. Both are useful; they are not interchangeable.
Break-in rates by state and territory
For state and territory comparisons, the ABS pools two survey years to make estimates more reliable. The figures below are 2023–25 pooled annual averages (average of 2023–24 and 2024–25), not a single financial year snapshot.
| State / territory | Break-in rate | Households affected (approx.) | Attempted break-in rate | Households affected (approx.) | % of break-ins reported to police |
|---|---|---|---|---|---|
| NSW | 1.5% | 51,400 | 1.4% | 46,000 | 65.5% |
| Vic | 1.9% | 51,700 | 1.7% | 46,000 | 74.4% |
| Qld | 2.5% | 54,200 | 3.6% | 78,700 | 73.5% |
| SA | 1.4% | 11,100 | 1.4% | 10,600 | 62.9% |
| WA | 2.3% | 25,600 | 2.3% | 26,600 | 75.6% |
| Tas | 2.1% | 5,100 | 1.6% | 3,900 | 74.5% |
| NT | 7.7% | 5,000 | 8.8% | 5,800 | 78.2% |
| ACT | 2.1% | 4,000 | 2.7% | 5,000 | 75.0% |
Source: ABS, Crime victimisation, 2024–25 — state and territory pooled commentary/tables for 2023–25.
What the state pattern suggests (without over-reading it)
- South Australia and NSW sit at the lower end of household break-in rates in this pooled period.
- Queensland and Western Australia are higher than the big south-eastern states on break-ins; Queensland’s attempted break-in rate (3.6%) stands out.
- The Northern Territory rate is much higher than other jurisdictions. Treat small-population estimates carefully, but the gap is large enough that it should not be ignored in any national conversation about property crime.
- Longer-term falls appear in several states since 2013–15 pooled data — for example, ABS commentary notes NSW break-ins down from 2.2% to 1.5%, Victoria from 2.4% to 1.9%, WA from 4.8% to 2.3%, and SA from 2.3% to 1.4%. Queensland’s completed break-in rate was similar across that span (2.5%), while attempted break-ins rose.
Important: these rates do not measure how many homes have CCTV. You cannot look at a state table and conclude “cameras caused the decline” or “cameras failed.” Crime trends move with policing, economics, drug markets, opportunity, housing design, and reporting behaviour.
Local police and BOCSAR-style recorded-crime dashboards can show suburb or LGA spikes that a national survey smooths over. For example, ABC reporting in 2026 cited NSW BOCSAR quarterly data showing higher break-and-enter rates in regional NSW than Greater Sydney — a reminder that “state average” is not your street.
What the research says CCTV can reduce
Most high-quality CCTV evaluations are not Australian door-camera trials. They are evaluations of camera schemes in public and semi-public places (car parks, town centres, housing estates), largely in the UK and US. That does not make them useless — it does mean you should translate findings carefully to a freestanding Aussie house with a Ring-style doorbell.
The strongest summary for general readers
The UK College of Policing crime-reduction toolkit summarises a large meta-analysis (76 studies, “Review one,” associated with the Piza / Welsh / Farrington line of CCTV reviews):
- Overall crime: about 13% lower in CCTV areas than comparison areas.
- Property crime: about 14% lower.
- Vehicle crime: about 14% lower.
- Drug-related crime: about 20% lower (fewer studies).
- Violent crime / disorder: no overall statistically significant effect.
- Car parks: largest consistent effect — about 37% lower crime (8 studies).
- Residential areas: about 12% lower crime overall (16 studies); only some individual studies were statistically significant on their own.
- Active monitoring (someone watching/responding): about 15% reduction; schemes without active monitoring did not show a significant overall effect in that analysis.
- Multiple complementary measures: pairing CCTV with lighting, fencing, etc. gave about 34% reduction; CCTV alone or with only one extra measure did not show a significant effect in that pooled analysis.
- Displacement: not the typical outcome in the studies that checked nearby areas (only a minority found clear displacement).
An earlier Campbell Collaboration systematic review (Welsh & Farrington; search completed 2007, published 2008) reached a compatible conclusion in plainer language: CCTV has a modest effect on property crime, is most useful in car parks, and is not an effective tool for preventing violent crime. Many successful car-park schemes bundled cameras with lighting, fencing, and guards — so cameras rarely deserve 100% of the credit.
Plain-English translation for Australian homes
Supported reasonably well:
- Cameras are more promising against opportunistic property and vehicle crime than against violence.
- Visible, well-covered, monitored systems beat hidden or “set and forget” gadgets.
- Cameras work better as part of a package than as a lone silver bullet.
Not well supported:
- “Home CCTV eliminates break-in risk.”
- “Any cheap camera equals the effect sizes in the meta-analyses.”
- “If break-ins fell nationally, it must be because of doorbell cameras.”
What Australian experts and police actually say
Australian commentary lines up more with “useful tool, limited miracle” than with marketing copy.
Australian Institute of Criminology (AIC) — Deputy director Rick Brown told the ABC (June 2025) that CCTV is useful for preventing certain crimes — especially vehicle crime (particularly in car parks), property crime, and crime around drug markets. That matches the international evidence pattern.
Griffith University — Technology and crime lecturer Ausma Bernot told the ABC the evidence is mixed, and cameras do not show a very strong, consistent security benefit for individual homes — while still noting deterrence logic (make the home less attractive) and complementary measures like fencing and dogs.
Deakin University — Professor Shiri Krebs told the ABC (July 2026) that any security improvement from cameras is quite minor, if at all, for broad security outcomes, with clearer literature on small decreases in car thefts. She emphasised cameras’ value for identifying suspects more than preventing every offence.
Queensland Police Service — QPS describes house break-ins as among the most common crimes and explicitly frames security cameras as one part of an overall crime prevention strategy, recommending a layered approach from the perimeter inward (visibility, hard entry points, alarms/lighting/CCTV, property marking, and residents actually using the security they already have).
NSW police commentary (via ABC, 2026) — Officers have described home CCTV as increasingly critical for investigations — identifying offenders and vehicles, corroborating statements, and speeding up cases — even while experts caution that cameras do not necessarily reduce crime on their own.
That split matters: prevention and detection are related, but they are not the same product benefit.
Why “cameras cut crime” is easy to overclaim
If you want a fact-checked article rather than a brochure, keep these traps in mind.
- Area-based camera evidence ≠ your eave-mounted Wi-Fi cam — Meta-analyses mostly evaluate area-based schemes. Your home system may deter a casual opportunist. It may also be ignored, covered, or defeated by someone who knows the blind spots.
- Correlation is not causation — States with falling break-in rates over a decade did many things besides buy cameras. WA’s large long-run decline in break-in victimisation is real in ABS pooled data; pinning it on CCTV alone would be guesswork.
- Victimisation surveys ≠ police-recorded burglary — ABS asks households what happened. Police stats count recorded offences under legal categories (unlawful entry, etc.). Definitions, reporting rates, and counting rules differ.
- Displacement and adaptation — Some offenders move to easier targets. Some wear hoods. Some hit unlocked windows at the side of the house the camera never sees. Research does not show universal displacement — but it also does not show universal deterrence.
- A camera that nobody checks is mostly a documentary device — The College of Policing summary is blunt on this point: active monitoring schemes performed better than passive ones in the pooled evidence.
When CCTV is most likely to help your home
Based on the evidence pattern — not on a specific Australian randomised trial of doorbell brands — cameras are more likely to earn their keep when you:
- Cover real entry paths — front door, side gate, garage, rear sliding door — not just the pretty facade.
- Make them obvious — deterrence is partly psychological; hidden cameras help after the fact more than before it.
- Get usable night images — many Australian break-ins and attempts involve doors/windows being forced; blurry black blobs help no one.
- Use alerts you will actually respond to — phone push alerts, siren/spotlight features, or a monitored alarm link beat footage you discover a week later.
- Pair cameras with harder physical security — quality locks, locked gates, sensor lighting, timed indoor lights, and not leaving tools in the yard that double as crowbars.
- Think vehicles too — evidence is comparatively strong for vehicle-related crime in surveilled parking environments; driveway and garage coverage is not a vanity angle.
- Keep footage long enough to matter — if you only notice a break-in when you get home from holiday, three days of overwrite is useless.
- Stay lawful — point cameras at your property, respect neighbours’ privacy, and be careful with audio recording under state surveillance rules.
A layered approach that matches the evidence
If you only remember one operational idea from police and research combined, make it this: cameras work best as layer four or five — not layer one.
A practical Australian household stack:
- Habits — lock doors/windows, don’t advertise emptiness on social media, bring bins in, cancel visible parcel piles.
- Deny easy entry — decent locks, reinforced strike plates where needed, locked sheds, restricted side access.
- Increase visibility — lighting, trimmed hedges near windows, neighbours who notice.
- Detect and deter — alarm sensors, cameras, signage.
- Limit the payoff — don’t leave keys, cash, or car keys in obvious places; mark property; store high-value items out of sight from windows.
- Recover and report — retain footage, report promptly, cooperate with police.
That is essentially the QPS “outside-in” logic, rewritten without the brochure gloss.
Bottom line for Australian households
- Break-ins remain a real household risk, even though the national rate in 2024–25 (1.8%) is lower than a decade earlier.
- Risk varies by place: state pooled rates range from about 1.4% (SA) to 7.7% (NT), and local regional rates can exceed capital-city averages.
- The evidence supports a modest role for cameras, especially with coverage, monitoring, and companion measures — and stronger evidence in car-park / vehicle-crime contexts than as a cure-all for residential burglary.
- In Australia, experts and police value cameras, but usually as part of a system and as an investigative tool, not as proof that break-ins will stop.
Buy cameras if they help you complete a layered plan — for help designing one, see our CCTV installation service. Do not buy them as a substitute for locks, lighting, habits, and a clear view of your actual risk.
Next step: Check your state’s recent break-in picture (ABS tables + local police/BOCSAR-style stats), walk your property at night like an opportunist would, then decide whether cameras fill a real detection/deterrence gap — or just add app notifications you’ll ignore. If you’re weighing up a system, our CCTV installer buyer’s guide covers licences, costs, and what to ask before you hire.
FAQ
Do cameras reduce break-ins in Australia? — They can contribute to lower property-crime risk in some settings, and international meta-analyses find modest average reductions for property crime. There is no strong Australian evidence that a typical home camera system reliably prevents break-ins on its own. Police and local experts usually recommend cameras as one layer among several.
Which Australian state has the highest break-in rate? — In ABS 2023–25 pooled household data, the Northern Territory had the highest break-in rate (7.7%), far above other jurisdictions. Among the larger states, Queensland (2.5%) and Western Australia (2.3%) were higher than NSW, Victoria, and SA.
Are break-ins rising or falling nationally? — In the latest ABS year, break-ins fell from 2.1% of households (2023–24) to 1.8% (2024–25). Over roughly a decade, the national rate is also lower than the mid-2010s. Short-term local spikes can still happen.
Are cameras better for stopping crime or solving crime? — Research supports some prevention for certain property/vehicle crimes. Australian police commentary often stresses investigation value — identifying people and vehicles, corroborating timelines, and supporting prosecutions.
Will a camera shift burglars to my neighbour instead? — Possible in individual cases. In the large evidence reviews, clear displacement was not the most common finding among studies that checked nearby areas — but absence of universal displacement is not the same as “no one ever moves next door.”
Should I still get cameras if the evidence is only “modest”? — Often yes — if you value deterrence and evidence after an incident, and you install properly. Modest average effects can still be worth it when paired with locks, lighting, and habits. Just budget and plan for a system, not a talisman.
Fact-check notes
| Claim type | Status |
|---|---|
| National ABS break-in 1.8% / 196,600 households (2024–25) | Supported — ABS latest release |
| Fall from 2.1% (2023–24) to 1.8% (2024–25) | Supported — ABS |
| State rates in table | Supported as 2023–25 pooled ABS estimates — not single-year rates |
| NT much higher than other jurisdictions | Supported by ABS pooled rates; interpret small-population estimates with normal survey caution |
| CCTV overall ~13% crime reduction; property ~14%; car parks ~37%; residential ~12% | Supported by College of Policing summary of the 76-study meta-analysis |
| Active monitoring and multi-measure packages perform better | Supported by same toolkit summary |
| CCTV not effective overall against violent crime | Supported by College of Policing + Campbell review |
| Home cameras strongly proven to cut Australian residential burglary by a specific % | Not supported — do not claim |
| National/state break-in declines caused by CCTV uptake | Not supported — causal claim unwarranted |
| AIC / academic / QPS quotes on mixed prevention vs investigation value | Supported via ABC interviews and QPS layered-security guidance as reported |
General limitations: International evaluations dominate effectiveness evidence. Survey rates have sampling error (ABS marks some estimates for caution). Police-recorded offence trends can diverge from victimisation surveys.
Sources
- Australian Bureau of Statistics — Crime victimisation, 2024–25 financial year
- Australian Bureau of Statistics — Crime Victimisation, 2023–24 financial year
- College of Policing (UK) — Closed-circuit television (CCTV) crime reduction toolkit
- Campbell Collaboration — Welsh & Farrington, Effects of closed circuit television surveillance on crime (2008)
- Piza, Welsh, Farrington, Thomas — CCTV surveillance for crime prevention: A 40-year systematic review with meta-analysis
- ABC News — Do security cameras deter thieves? (15 June 2025)
- ABC News — Security camera installation in homes is on the rise. Will it deter crime? (21 July 2026)
Caveat: This article is general information for Australian readers, not legal, insurance, or security-engineering advice. Verify local crime figures and licensing/privacy rules for your state or territory before installing cameras.